Orders, lines and waves
Timestamped demand, SKU velocity, order size, cutoff logic, cancellations and replenishment for the truck routes under review.
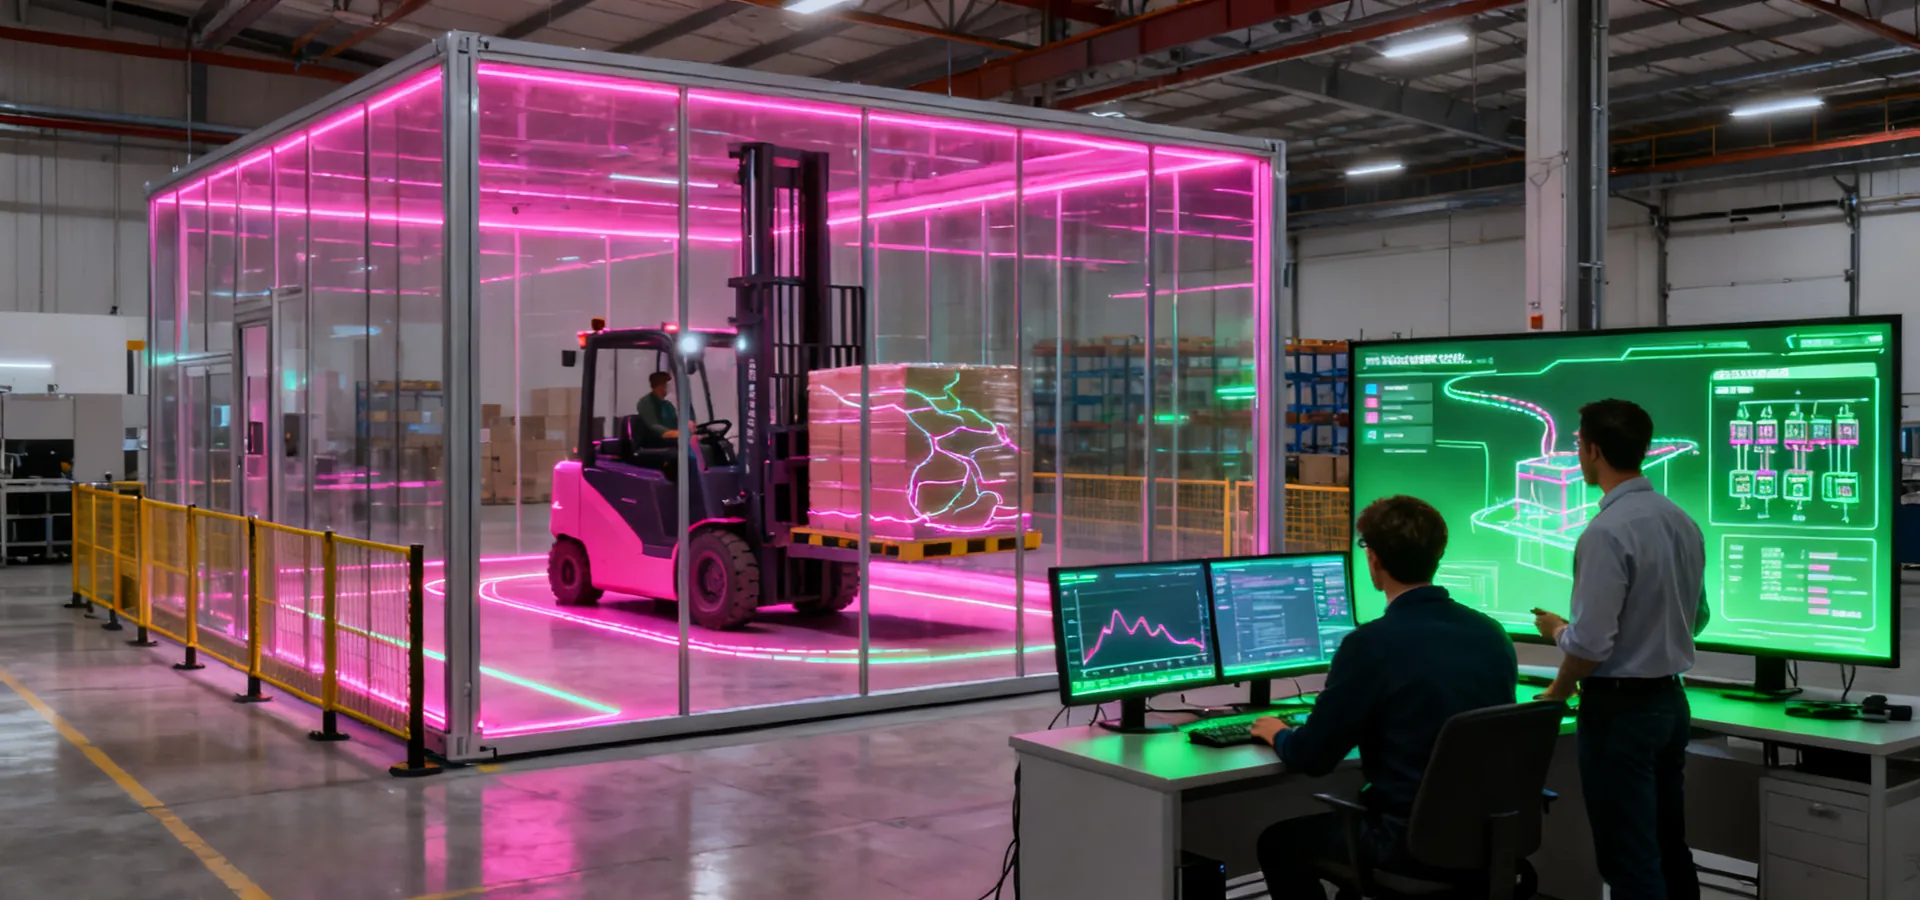
Expose throughput assumptions, aisle congestion and recovery paths before the live warehouse becomes the test environment. Models remain useful only when their inputs, simplifications and acceptance links are visible for multidirectional forklift and stacker fleets.
Inspect the input contractThe input contract names source, period, owner, unit and treatment for each dataset. Order history is separated from forecast scenarios. Physical travel distance is separated from nominal truck speed. Failure and recovery assumptions are listed beside the responsible control layer.
Missing information is not silently replaced by a favorable default. It is marked as an assumption with a sensitivity test, an owner and a date for confirmation—so later design changes stay traceable instead of turning the HUBTEX model into an unreviewable black box.
Timestamped demand, SKU velocity, order size, cutoff logic, cancellations and replenishment for the truck routes under review.
Rated load in kg, center of gravity, fork length, pack length, aisle clear width in mm, floor class and station envelope.
Priorities, batching, charging, blocked destinations, retry limits and manual interventions for four-way and side-loader fleets.
WMS, WCS, WES, PLC and fleet messages, interface cycle time in seconds, confirmations, timeouts, alarms and ownership.
Every reported output carries the scenario identifier, input revision and warm-up or observation period. A result is interpreted inside that boundary rather than promoted as a universal truck-system rate.
Tests normal SKU and order distributions, replenishment, breaks and routine aisle variability. The baseline checks whether queues are stable before peak or failure cases are introduced for long-load and pallet missions.
Raises release demand for the defined duration while retaining realistic dock and putaway capacity. This distinguishes a brief burst from a fleet that holds stable output throughout the shipping cutoff.
Removes a route, truck, charger or dock door and applies the agreed control response. The run shows whether failure remains isolated and how much time is required to clear accumulated work.
HUBTEX Digital Twin Lab exercises command, acknowledge, timeout and alarm paths across layers so duplicated decisions and silent failures appear in the lab—not on the first live peak. Emulation is not a substitute for FAT or SAT; it reduces the set of surprises those gates still must prove.
Ownership for each message class is recorded beside the scenario ID. When a layer is out of scope, the model marks that boundary instead of inventing behavior that no party will maintain.
Design rate, factory cases and site measurements share one register. A twin result that cannot point to an acceptance ID remains a planning aid, not a handover claim.
Each throughput number cites SKU mix, peak duration, buffer rules and the scenario revision used.
Factory scripts reuse the same load centers, travel modes and fault injections exercised in the twin.
Site protocols measure aisle mm, floor class, traffic rules and recovery clocks against the same IDs.
Share load units, order profiles, peak windows, interface owners and site constraints. We will confirm which scenarios can be modeled and which assumptions still need owners before any rate is presented.